73 lines
3.9 KiB
Markdown
Executable file
73 lines
3.9 KiB
Markdown
Executable file
pySmithPlot
|
|
===========
|
|
|
|
## New Release of Version 0.2
|
|
|
|
After 2 years of getting dusty **pySmithPlot** now got some new features and bug fixes. Here is a short changelog:
|
|
|
|
- **Support for Python 3**
|
|
- improved grid generation algorithm
|
|
- plot() now also handles also single numbers and purely real data
|
|
- plot() can now interpolate lines between points or generate an equidistant spacing
|
|
- changed handling of input data and renormalization; now the actual datatype (S,Z,Y-Parameter) can be specified when calling plot()
|
|
- changed behaviour for normalization and placement of the label
|
|
- added some parameter checks
|
|
- removed default `matplotlib` settings
|
|
- renamed some parameters to improve consistency
|
|
- fixed issues with Unicode symbols
|
|
- fixed issues with grid generation
|
|
- fixed issues with axis label display and placement
|
|
|
|
There are still some plans for the future and they hopefully don't take another two years:
|
|
|
|
- [ ] support for Admittance Charts
|
|
- [ ] support for `contour()` plots
|
|
- [ ] zoom and 'cut out' function
|
|
- [ ] special handling of other `matplotlib.patch` objects like arrows
|
|
- [ ] ...
|
|
|
|
## Features
|
|
|
|
**pySmithPlot** is a matplotlib extension providing a projection class for creating high quality Smith Charts with Python. The generated plots blend seamless into matplotlib's style and support almost the full range of customization options.
|
|
|
|
This Library allows the fully automatic generation of Smith Charts with various customizable parameters and well selected default values. It also provides the following modifications and extensions:
|
|
|
|
- circle shaped drawing area with labels placed around
|
|
- plot() accepts real and complex numbers as well as numpy.ndarray's
|
|
- lines can be automatically interpolated to improve the optical appearance
|
|
- data ranges can be interpolated to an equidistant spacing
|
|
- start/end markers of lines can be modified and rotate tangential
|
|
- gridlines are 3-point arcs to improve space efficiency of exported plots
|
|
- 'fancy' option for adaptive grid generation
|
|
- own tick locators for nice axis labels
|
|
|
|
For making a Smith Chart plot, it is sufficient to `import smithplot` and create a new subplot with projection set to 'smith'. (Requires matplotlib version 1.2)
|
|
|
|
A short example can be found in the `testbenches` directory and started with:
|
|
|
|
python3 smith_short_test.py
|
|
|
|
For more details and documentation, take a look into `smithplot/smithaxes.py`.
|
|
|
|
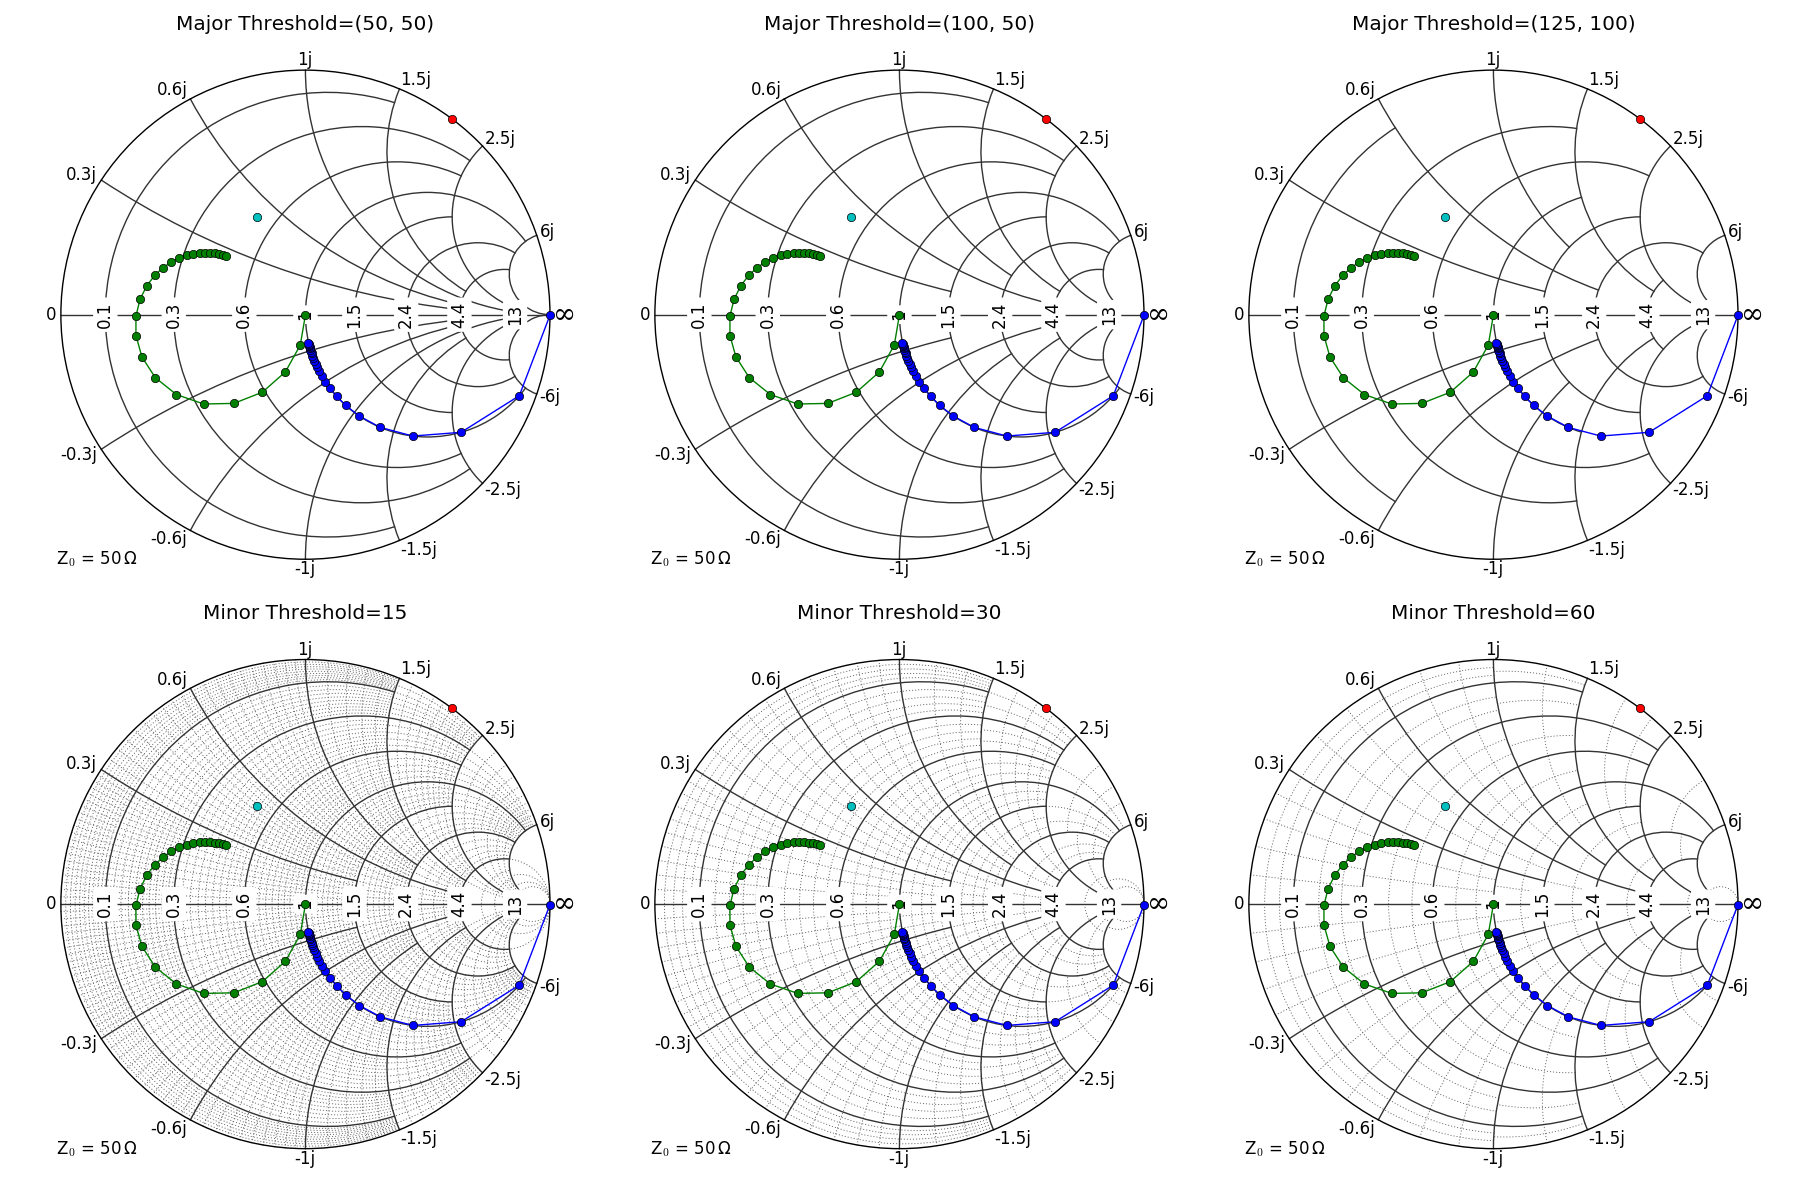
`testbenches/smith_full_test.py` runs various testbenches and gives a comparison for almost all parameters. These are the generated sample plots:
|
|
|
|

|
|
[Grid Styles - PDF](https://github.com/vMeijin/pySmithPlot/wiki/images/examples/sample_grid_styles.pdf)
|
|
|
|

|
|
[Fancy Threshold - PDF](https://github.com/vMeijin/pySmithPlot/wiki/images/examples/sample_fancy_grid.pdf)
|
|
|
|

|
|
[Grid Locators - PDF](https://github.com/vMeijin/pySmithPlot/wiki/images/examples/sample_grid_locators.pdf)
|
|
|
|

|
|
[Marker Modification - PDF](https://github.com/vMeijin/pySmithPlot/wiki/images/examples/sample_markers.pdf)
|
|
|
|

|
|
[Interpolation - PDF](https://github.com/vMeijin/pySmithPlot/wiki/images/examples/sample_interpolation.pdf)
|
|
|
|

|
|
[Normalize - PDF](https://github.com/vMeijin/pySmithPlot/wiki/images/examples/sample_normalize.pdf)
|
|
|
|

|
|
[Miscellaneous - PDF](https://github.com/vMeijin/pySmithPlot/wiki/images/examples/sample_miscellaneous.pdf)
|